Primary Crypto-trading Tools on HitBTC Exchange
Trading Bitcoin and Altcoins isn’t easy. To let you concentrate on the most important thing – decision-making – we’ve got lot of helpful tools and indicators on our platform. If you are already a master trader then this article is probably not for you. So don’t get sad if we are blatantly stating the obvious. All new traders who want a bit of help – I will explain the little tricks and gadgets we’ve added to help you make better decisions when trading. Also I will walk you through how to place your trades and explain trading jargon a bit.
Price chart: The heart of the trading platform

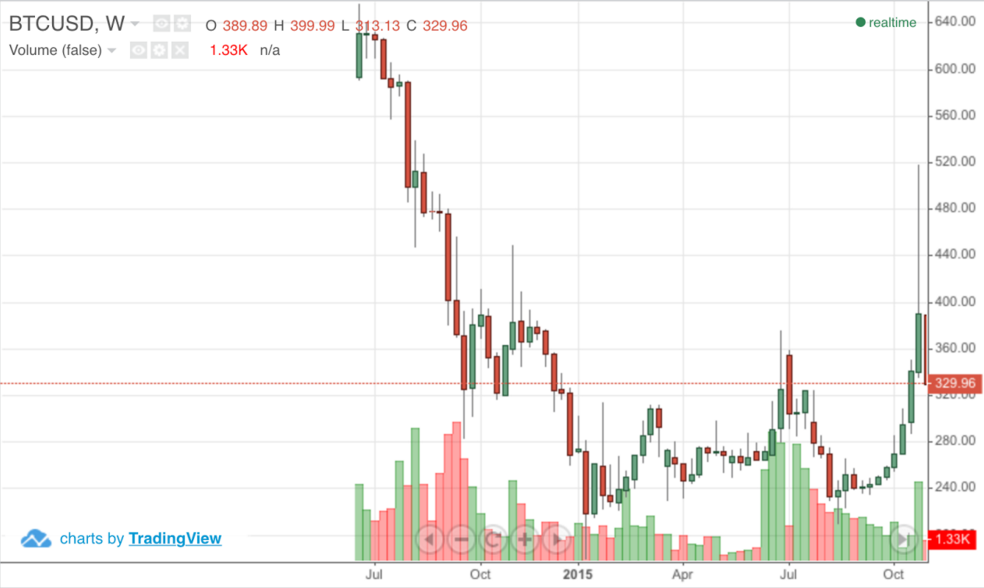
Here you can see the price chart of your selected currency pair ( you can change the traded currencies at the top). This is a candlestick chart. This means that every candlestick represents the selected periodicity. At the top of the chart you can select the periodicity: m1;m3;m5;m15;H1;H4;W1;M1.
So if your selected periodicity is W1 that means that one candle represents the price movements within a 1 week period. The bars will either be red or green depending on whether the price moved down or up from the start of the candlestick bar. The long lines on the tops and bottoms of the bar are called shadows. They show how high or low the price reached during the time the candle was open. The body (the full coloured part or the candlestick) shows at what price the candlestick opened and closed. For example a green candlestick’s opening price is at the bottom of the body and closing price at the top. The opposite applies to the red candles. Read more about candlestick charts here.
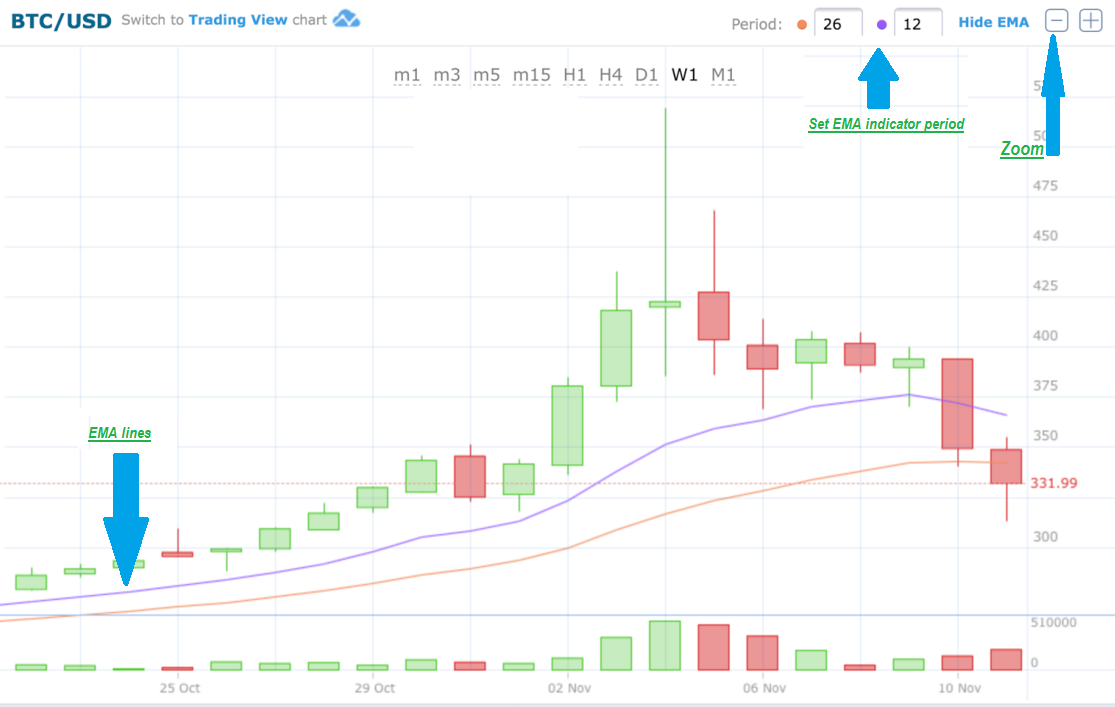
You can zoom in and out using the +/- buttons at the top right corner of the chart.
Next to the zoom buttons you can set the EMA indicators periodicity. EMA stands for Exponential Moving Average and is a really helpful tool – it can calculate likely points for the change in direction for you. This way you can make better decisions on when to enter and exit a trade. Read more about Exponential Moving Average here.
Placing trades on HitBTC
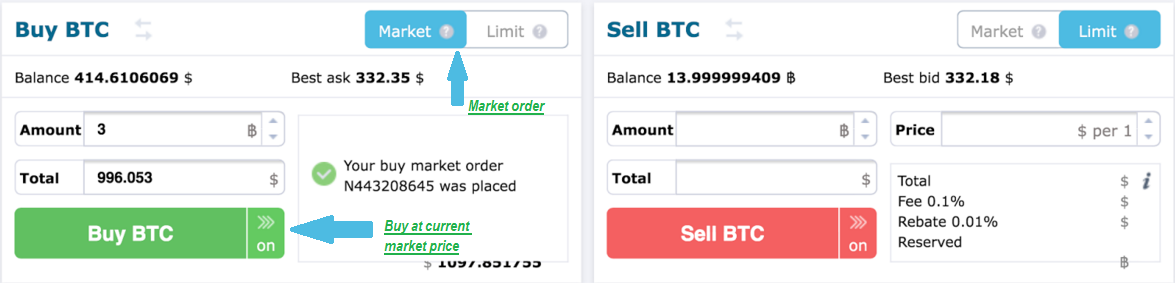
You have two options of placing trades:
- Market price order – with this option you can both buy and sell at the current market price at the time of placing the trade. That means you are buying the currency for exactly the price it is at the time of the execution of the trade

2. Limit order – here you can determine at what price you want to buy or sell. For example if you set your limit to buy at $300 the transaction will be done when the price reaches $300. The same with selling – your currency will automatically be sold at the price you choose when the currency reaches this price.
Other instruments
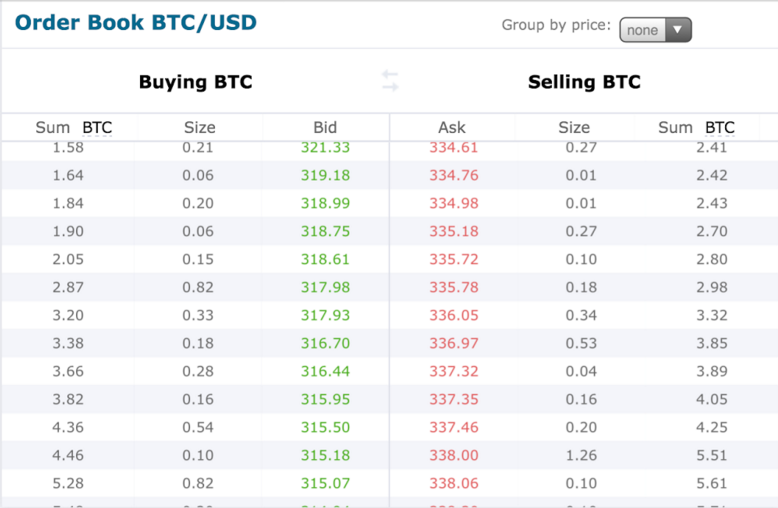
Below the instruments for placing trades you have the Order Book, which is a list of limit orders traders have placed that have not yet been executed.
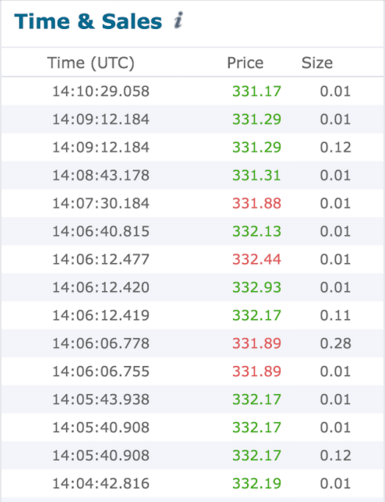
Time & Sales show you the 50 latest trades placed on our platform for the selected currency you are currently viewing.
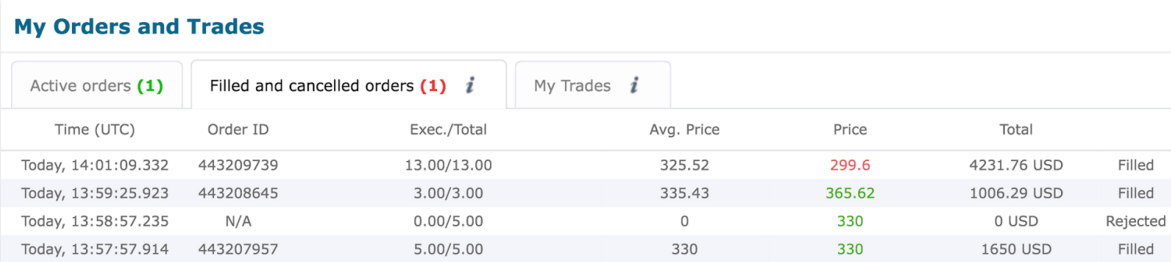
Below the Order Book you can see your trading history. You can view your active orders that are currently still ongoing, your filled and cancelled orders for the last 24h and also your trading history for the last 24h.
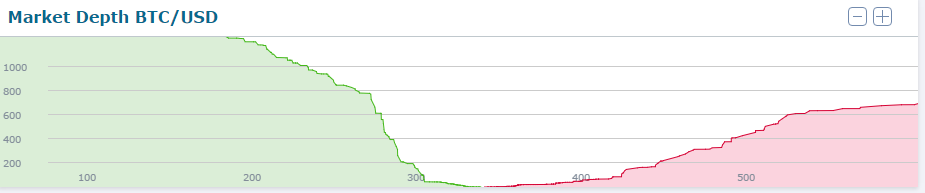
Market Depth this is the size of an order that is needed to move the market price by a given amount. In deep market conditions you would need a large order to see a change in the price.
Trading View
We’ve also thought about the experienced trader – Trading View is for you. We try to suit all of our traders’ needs, because you are all important to us. Switch to Trading View chart on the top left corner of the chart you get access to so many more tools and indicators. Let’s walk you through these now.
- At the top you can select the periodicity of your chart. I briefly mentioned this above in the candlestick paragraph.
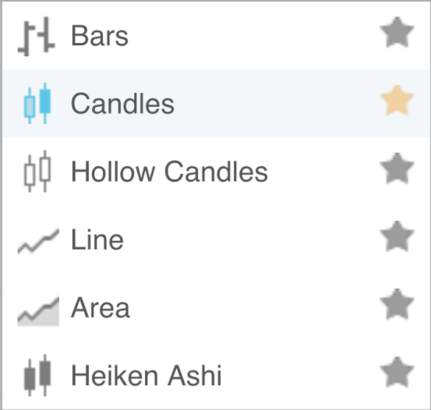
- Next to this you can select the type of the chart that is displayed – you can choose between many different options. The candlestick chart is the most popular and commonly used in the trading world but I’m not saying it is the only way to go. Have a play around with different charts and find your personal preference.
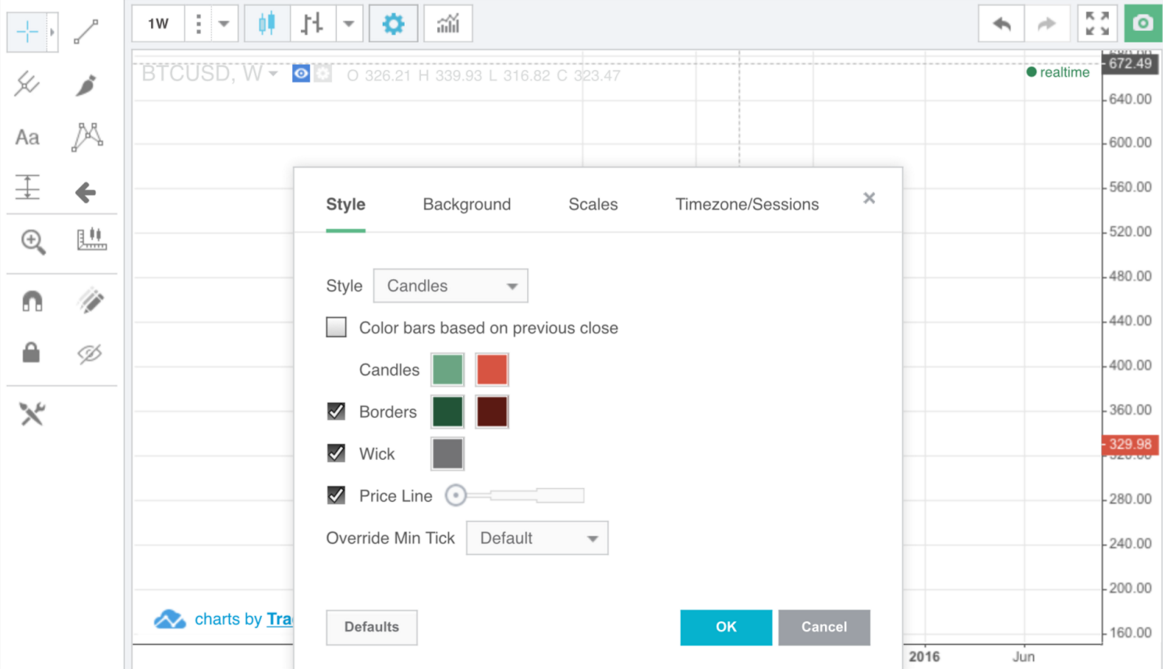
- Next up are settings – you can customize the colours of your charts. Find the visually best options for you in terms of the bars and the background. You can also set your timezone.
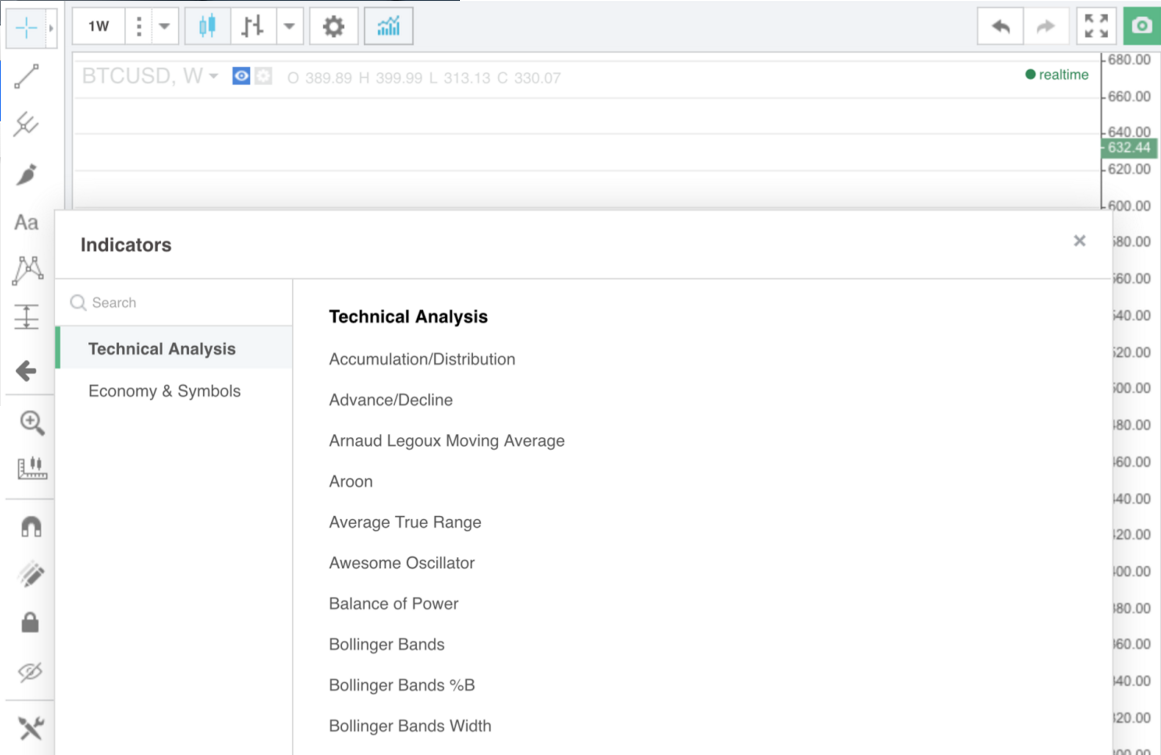
- Last but not least – indicators. I spoke about EMA when showing you the HitBTC chart. Here you have a lot of other useful indicators to choose from. These will really help your technical analysis further. Find the ones that best suit your strategy and apply them to your charts.
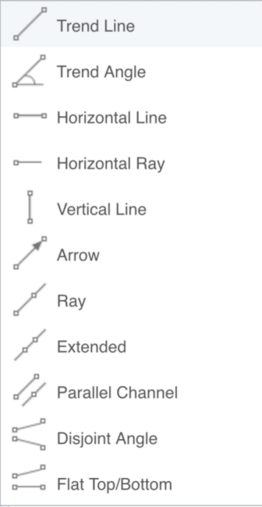
On the left bar you can select various tools to help your trading even more. You can draw pitchforks, set support & resistance levels and also draw trend lines and corridors. On top of this you can also determine patterns, projections and forecasts. You can write notes on your chart and play around with many more useful stuff. The Trading View has all the tools an advanced trader would ever need.
If you are a beginner I recommend finding a great strategy and playing around with different indicators and tools on our demo account to find the ones you like most.
Better platform for you
We are constantly improving our platform and trying to find ways to help you in your trading. Functionality and the right tools can be of great help and this is why we are also working on putting together a thorough trading course. This will be available for all of our customers, completely for free. Why don’t you sign up for our newsletter to make sure you can keep up to date with all the new shiny stuff we’ve made for you. To start your trading story, click here.