Bitcoin Market Analysis: November 17-23
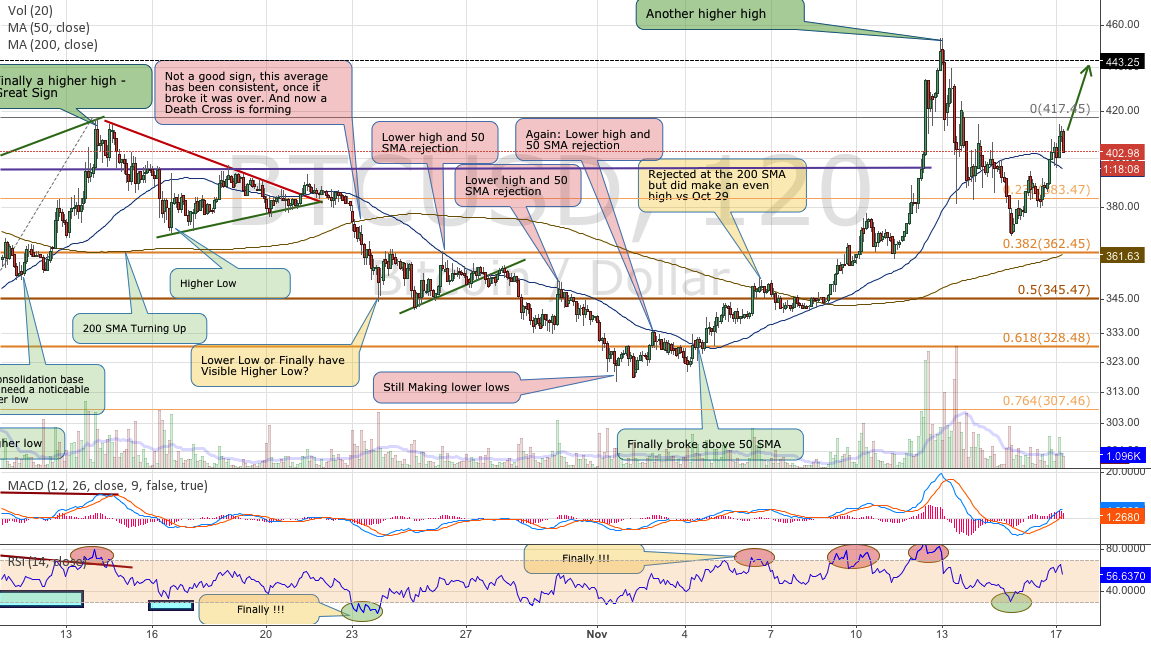
Bitcoin’s volatility was the news this past week. Last week’s conclusion was pretty clear in stating that it was expected for the 50-day SMA to put a pause in this rebound and prices needed to pull back. Traders however had other ideas and drove the market straight past the $375 resistance reaching a high just shy of the 200-day SMA at $450 or so before pulling back to the start of the breakout which was the $370-375 zone.
This price action is very indicative of a market driven completely by traders. If there were any fundamental changes in Bitcoin’s standing, the price would not have fallen as fast as it went up on no news. In fact it was pointed out in another article how this entire up move was pre-ran in the Futures markets like 796 and most likely OKCoin and Huobi. That means that enough people knew that this move was coming that plenty of long contracts were initiated in preparation. The profits from those long contracts were not fully realized due to the fact that winner get taxed on any counterparty losses suffered by the exchange when they are not able to liquidate Margin Called positions on time. So for example BitVC (Huobi) had to remove 45% from the winners on their November 14 contact.
So where do we go from here? We try to do our best to see where prices are going and as always go back to the charts. Traders need to recognize their mistakes early and get out of losing position and or reverse them. For example, if you are expecting the 50-day SMA to reverse the slide but instead it gets broken to the upside, it’s a good indication that prices will keep going till the next level of resistance. On the pull back this same 50-day Moving Average was now support and it held it pretty well.
The Month Ahead
Whether trader driven or not, the move to create a new high vs. the one in October and the higher low that was put in just before the end of October has now created a new up trend with higher highs and higher lows. Looking at the charts we have not seen something like this the entire year so this seems like a pretty good sign that things are looking up. Now that we have spent half a day above $400 there is a very good chance that we should be re-testing $450 soon and if we break above that, the 200-day SMA should be right there as well. Above that resistance stands at $500 then about $560.

The Week Ahead
It seems like the longer it take for the RSI to get to the Overbought level the longer it stays up there but this time when the prices started to fall we quickly reached the Oversold level. There is definitely room to go up right here with the MACD positive and increasing and the RSI still has some room.
Conclusion
The charts look pretty bullish now that we had a nice pull back down to the low $370’s. A reasonable idea is go long here looking for new highs or at least $450 with the 50-day moving average currently at $380 as your stop loss. There is resistance in the $440-450 zone then $500 and $560. On the down side, if we fall back bellow $375, there is still plenty of support without considering the bullish trend lost. We have $330, and $315. As long as the $315 low holds, we maintain out trend of higher highs and higher lows.
Reference Point: Monday Nov 17 8:00 am ET, HitBTC Price $405
About the author
Tone Vays is a 10 year veteran of Wall Street working for the likes of JP Morgan Chase and Bear Sterns within their Asset Management divisions. Trading experience includes Equities, Options, Futures and more recently Crypto-Currencies. He is a Bitcoin believer who frequently helps run the live exchange (Satoshi Square) at the NYC Bitcoin Center and more recently started speaking at Bitcoin Conferences worldwide. He also runs his own personal blog called LibertyLifeTrail.